Get on the Right Color Management Wavelength with Monthly Insights from 10,000+ Color Professionals Around the World.
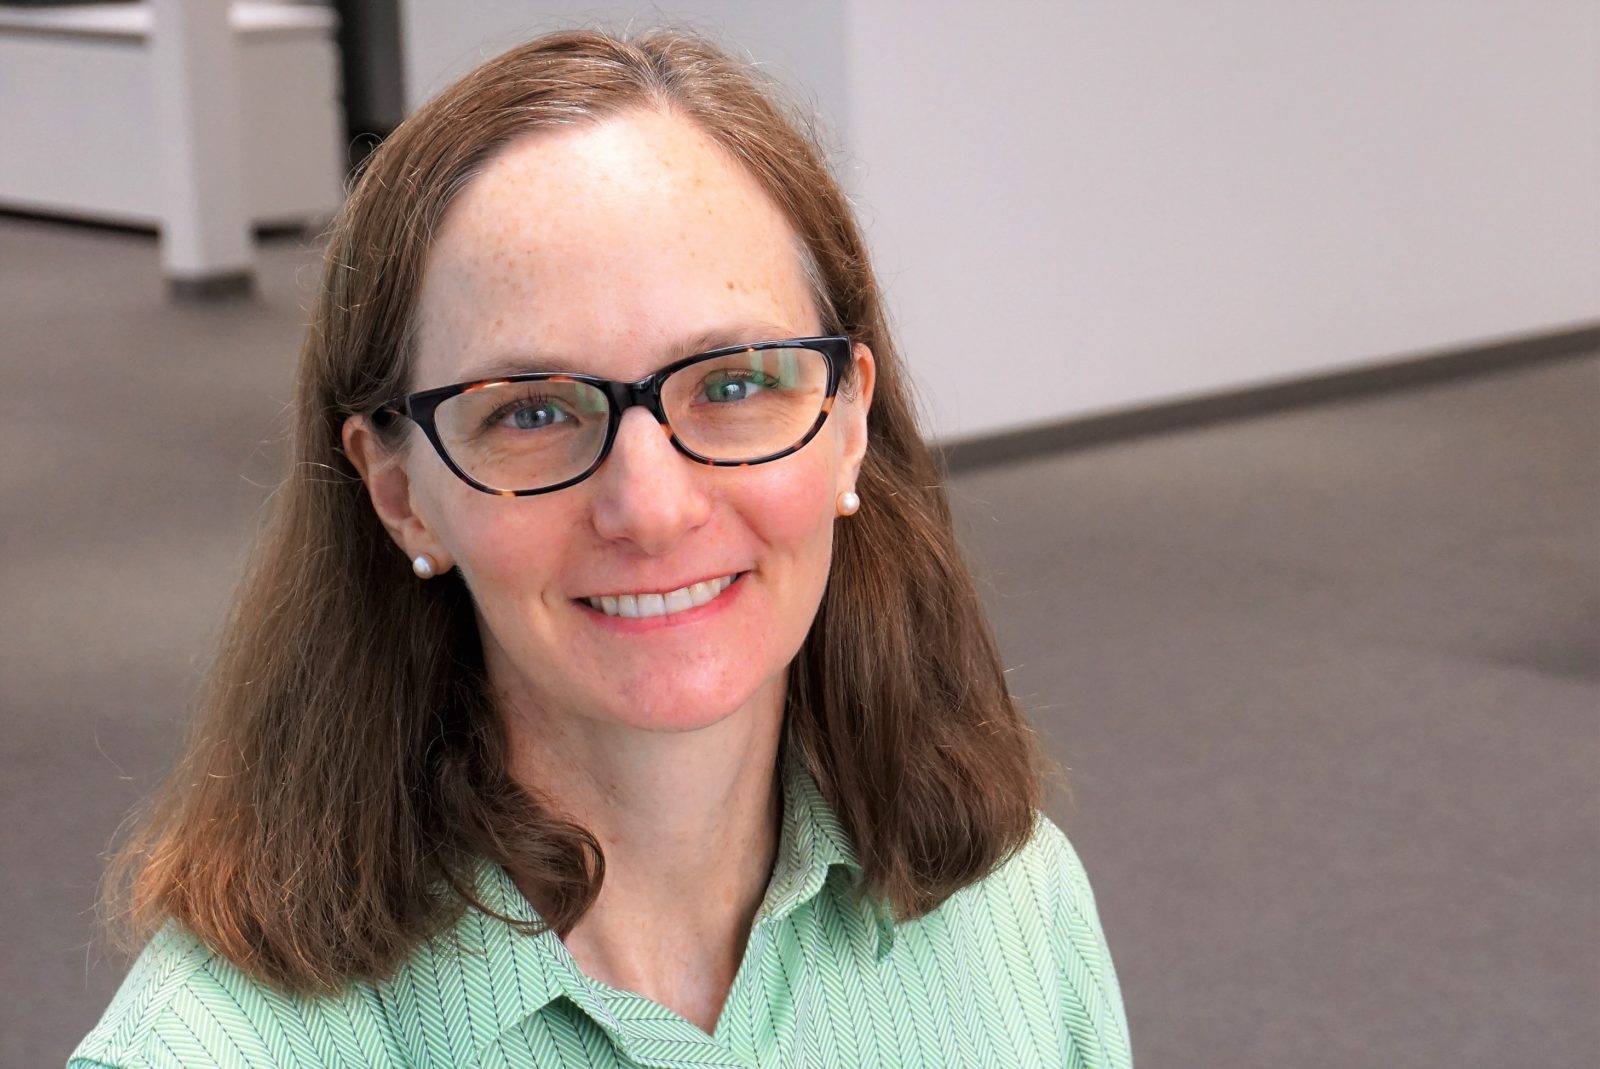
Job Title: Research Scientist
Alma Mater: University of California San Diego
Favorite color: “I do have a lot of purple and gray in my closet! But for art I like bright colors, like Chagall.”
Favorite type of food: “New Orleans fare. I just went there on a work trip (an ASTM meeting), and it was a great experience.”
Favorite activity: “Dragging my kids to all kinds of museums and on hikes. They’re always complaining, ‘I don’t want to walk!’ but because we’re right between Philly and New York, there’s so much to do and see here.”
Fun fact: “In college I worked for the Appalachian Mountain Club. We had to trek the supplies for hikers who would backpack hut to hut along the trail. We had to be outside constantly and maintain the huts. It was a good experience, and I’m glad I had it.”
Most of us are content to simply swim in the ocean. Kate Edwards, on the other hand, built a career around studying it. And now, this former oceanographer is applying her knowledge to something entirely new: color science. Well, not ENTIRELY new. Kate, who joined Datacolor as a research scientist in 2017, says there’s a lot of overlap between the two fields.
“I’m actually not the only person at Datacolor who has a background in physical oceanography,” Kate said. “Physical oceanography is studying what makes water move. When you take the energy in ocean waves and you divide it up by wavelength, you use a lot of the same methods as when you take light and divide it into wavelengths — which makes color.”
Before she joined the Datacolor team, Kate also worked with satellites to measure the color of the ocean to understand biological growth or identify where one kind of water meets another (which is marked by two different colors). All this experience made her a great fit for her current role.
From satellites to color systems, Kate is a veritable one-woman wonder of knowledge! Here’s what she had to say about her work at Datacolor so far.
Patterns and Products – Kate’s Course to Color
Kate may be an official newcomer to the color industry, but her long-time interest and understanding of color science meant she wasn’t starting from square one. So, what does color mean to her?
“I think color is incredibly interesting, because there’s a scientific side to it, where you can measure and learn facts about how you see and understand color. But there is also an emotional side,” Kate says. “For example, designers use very emotional terms. They’ll say, ‘I want something that feels like Paris in the 1930s.’ And that’s really unfamiliar to me.”
“My recent projects have sparked a personal interest in historical patterns. I’ve gotten all kinds of books out on the subject, and it’s a whole world. I think it’s interesting to see that patterns and colors are a way that people are communicating, that they do create a feeling or emotion from the person wearing them or looking at them.”
Datacolor is an inspiring place to work — especially for members of our research team. With that in mind, we asked Kate to share the most significant project she’s collaborated on since she started working at Datacolor. Her answer? SpectraVision.
“SpectraVision has been a large undertaking,” she says. “It involves a new application of using a camera to measure the colors in a pattern like a more traditional sensor does for solid colors. With SpectraVision, we can measure a textile pattern or something that’s made up of different materials without the user having to do it painstakingly piece-by-piece. I’ve been working to separate the pattern colors in a similar way to what we do visually. This is tricky because a lot of times there is blending between color regions. It’s not always crisp separations.”
“My former work has been a great starting point, because we took satellite images of the ocean or land and separated out one current versus another kind of current. There are constantly new developments in the field of image processing, and we’ve used much of that relevant research to create the color separation routines in SpectraVision.”
Finally, with her multi-faceted, far-reaching background, we wanted to know what drew Kate to join theDatacolorteam as a Research Scientist
“What I really like here is that in research, you’re sort of a glue between certain areas,” she says. “You can reach out and take in the problems customers are reporting and look into them, or ask questions like ‘What do we want to implement in the software?’”
“Then you talk to the programmers or people checking the software. Or to find out what’s coming down the pipe, you talk to the project managers. You get to be really collaborative and connect with people. There are some partners who have been here 20-30 years, and they know so much about color. Everyone is really generous with their knowledge and helping you get up to speed in different areas.”
 Job Title: Research Scientist