Learn about color at your own pace.

color selection
Color and appearance

1. Color and appearance

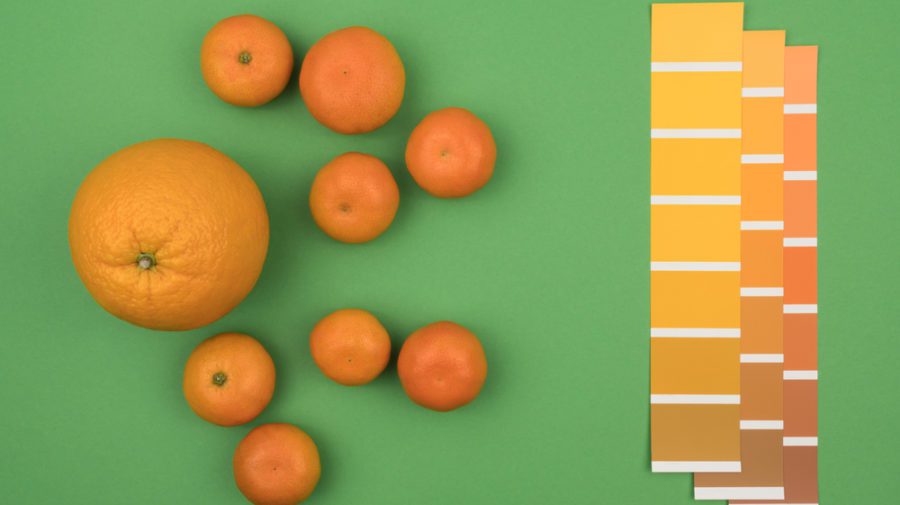
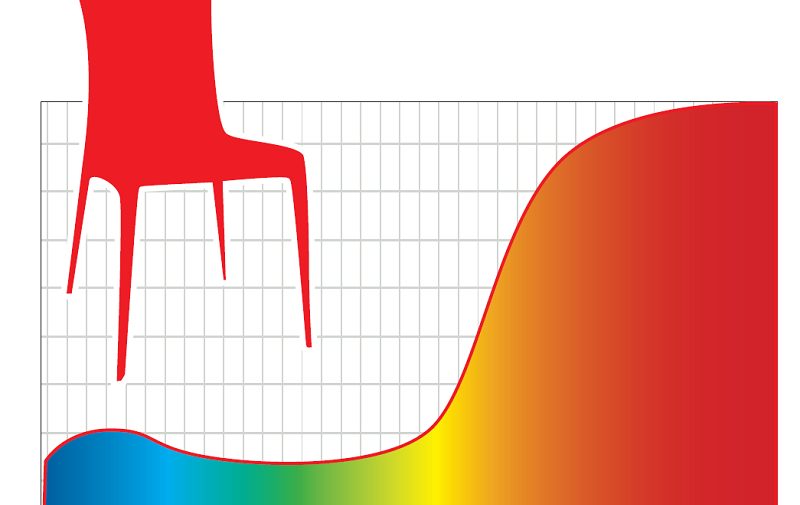
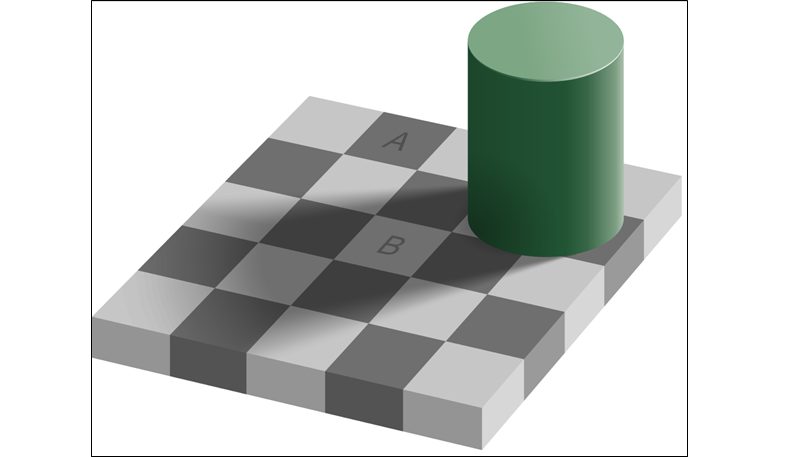
What do object properties, a specific light source or even differences in human eyesight have to do with color? Everything, because all those aspects influence color perception! Watch the webinar to find out how!

Download Presentation >

Color communication

2. Color communication

We all talk about colors, right? But how exactly do you communicate about a color? Let’s talk you through L* (Lightness), C* (Color) and H* (Hue) and read some spectral curves together during this webinar.

Download Presentation >

Color Coordinates and Color Difference

3. Color coordinates and color difference

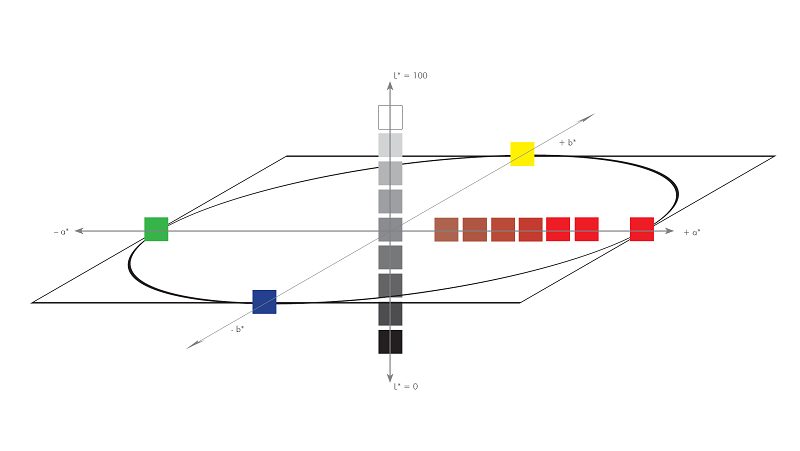
In this webinar, learn how to best express the color you need for your paint, your coating, or any other object! Join us to explore CIE tristimulus values and the CIELAB color space, and we’ll calculate color differences together.

Download Presentation >

Color Tolerance

4. Color tolerance

In most industries, color consistency across multiple materials and iterations is required. Now that we acquired a common language in color, let’s focus on colorimetry and how to measure and record color differences. We’ll go into Delta E, color tolerance and color acceptability.

Download Presentation >

Visual and Instrumental Color Evaluation

5. Visual and instrumental color evaluation

Wondering about the best way to evaluate color? Let’s define the necessary conditions to evaluate color, and review how a colorimeter or a spectrophotometer can do the job for you!

Download Presentation >

Datacolor Spectro 1050

1. Fine-Tuning Your Spectrophotometer

Explore the proper use and maintenance of a spectrophotometer to ensure accuracy in sample measurement. Instrument settings, calibration, and diagnostics are all vital elements of successful spectrophotometer use.

Datacolor Tools for data presentation

2. Enhancing Data Presentation To Support Effective Decision Making

Learn more now on how to present data in a well-organized way for effective evaluation of sample quality and accurate decision making. We also show how to sort data in the Datacolor TOOLS data template.

Datacolor Tools Plots

3. Getting The Most Out Of Graphs and On-Screen Color For Evaluating Color Quality

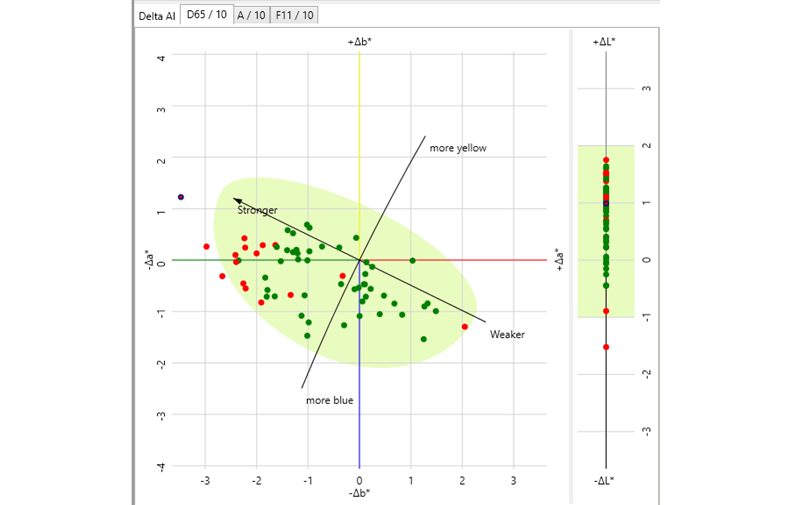
In this webinar session we discuss the best ways to utilize various colorimetric graphs and display color on-screen, as available in Datacolor TOOLS, to interpret numerical color differences. We also investigate the unique functions available for creating a “virtual light box”.

Sample measurement

4. Sample Measurement Do’s And Don’ts

In this webinar session we discuss sample measurement techniques for various sample types with a goal of understanding how to ensure the accuracy of your reflectance data.

5. Put Your Colorimetric Pass/Fail Decisions To The Test

Looking at color quality control software, we discuss creation of colorimetric tolerances for pass/fail decisions. We use Datacolor TOOLS software as an example, and we explore the use of Metamerism Index as a measure of sample acceptability.

• Customer Stories •

Read More Stories from Customers Like You

Success comes in different forms for different clients. Discover more ways Datacolor delivers. See More Stories ›

Classroom Color Seminars

Bring Ideas to Life with Color Management

When data meets color, inspiration meets results.c

More