By Michael Brill
The short answer is “no”. But it’s not that simple.
The color management industry uses a number of different systems to mathematically describe colors, but there isn’t one single accepted standard. There’s also no way to convert one color system to another. That means the degree of color variation measured with one system can’t be accurately compared with measurements from another.
Specific systems have been defined over the years to meet particular purposes. Manufacturers often focus on one type of system, depending upon the primary purpose of their instruments and the needs of the industries that use them. In commercial production, only measurements using the same color space can generate consistent results.
In this article, we’ll provide a high-level overview of color systems to help you navigate their differences.
(Editor’s note: If you’re looking for a more in-depth explanation of color fundamentals, we recommend downloading our ebook series, Principles of Color Management. You’ll find detailed information on color spaces, systems and formulas in book four.)
What is a color space (and a brief history)?
A color space is a three-dimensional model that describes a set of colors mathematically in relationship to each other. Colors are mapped along axes that represent different aspects of color such as hue, or saturation. The mapped aspects vary depending upon the type of color space.
CIE RGB, XYZ
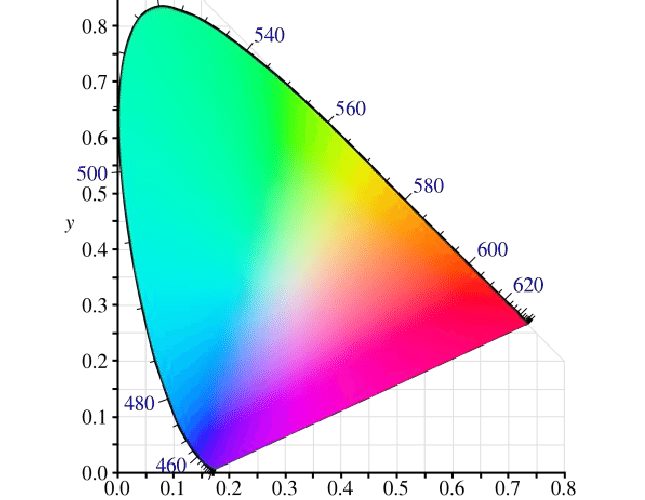
Color management software typically uses variants of the color space XYZ defined in 1931 by the Commission International de ľéclairage (CIE). The XYZ space is based on color-matching experiments, whereby human observers find, for any spectrum of light, a matching mixture of three chosen primary lights, which are typically monochromatic at wavelengths labeled red (R), green (G), and blue (B). R, G, and B are like a palette of lights, and the recipe of the mixture has coordinates called tristimulus values. For any RGB palette, some lights have negative quantities in their tristimulus recipes.
Therefore, the CIE derived a space XYZ whose primaries are not representations of real lights, but allow any recipe of a real-light match to comprise non-negative tristimulus values (called X, Y, Z).
What is the CIELAB Space?
The CIELAB space (with coordinates L*,a*,b*) is a coordinate remapping of the matching space XYZ. CIELAB, defined in 1976, is intended to be perceptually uniform, meaning that the distance between mapped colors corresponds to their visual differences.
In rectangular coordinates, CIELAB expresses colors according to three values:
- L*: Lightness, from black (0) to white (100)
- a*: Amount of green (-) to red (+)
- b*: Amount of blue (-) to yellow (+)
The CIELAB difference between two colors in these coordinates, called CIELAB DE, is just the Euclidean square-root-of-sum-of squares of the coordinate differences.
When represented in cylindrical coordinates of lightness (L*), hue (h*) and chroma (C*), the chromatic relationships are relatively easy to see, so people often prefer these coordinates to the rectangular ones—even though the color difference equation looks just a bit more complicated.
What is CIEDE2000?
CIEDE2000 is a color-difference equation, not a color space. It’s a calculation that uses CIELAB coordinates, but brings color differences closer to what the human eye actually perceives.
A helpful analogy: Let’s say you need to drive to the store. A CIELAB DE might reveal that the store is three miles away. But you’re really interested in travel time, not distance. In that context, CIEDE2000 is similar to evaluating the travel time knowing not only where the store is, but that it’s rush hour and might take you longer than anticipated.
Why CIELAB DE and CIE2000 DE Figures Aren’t Compatible
The amount of color variation considered acceptable in production work depends upon business factors. To quantify that variation, samples must be measured and assigned numeric values. The difference/distance metric between colors when using CIELAB is ΔE (Delta E). Although CIEDE2000 uses CIELAB coordinates, it expresses a distance between two colors using a different mathematical formula than the simple sum-of-squares Euclidean formula used by CIELAB. Therefore, CIELAB DE and CIE2000 DE figures aren’t comparable. In general, CIE2000 DE numbers are smaller than those for CIELAB.
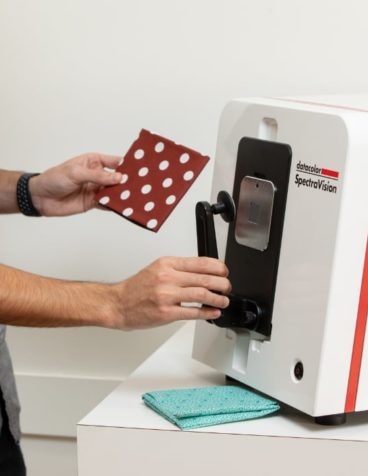
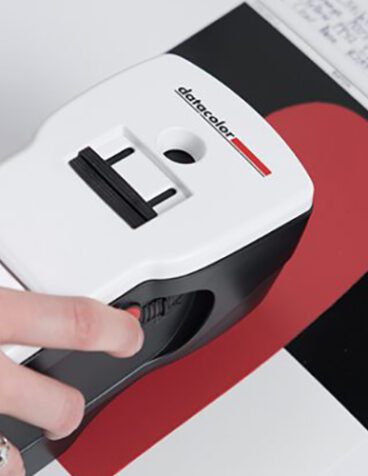
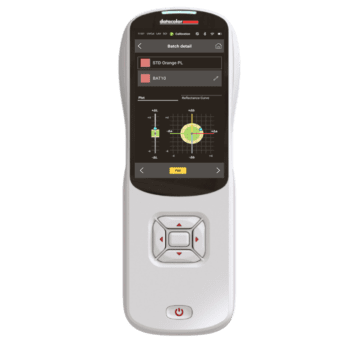
What to Watch Out for When Purchasing a Spectrophotometer
Since the color difference numbers for CIELAB DE and CIEDE2000 aren’t compatible, product specifications for instruments using the two different systems shouldn’t be directly compared. Making the distinction can be tricky, since both can be called just DE. Most instrument specs use CIELAB in order for customers to easily compare different products. Some companies, however, use CIE2000 DE figures. If listed together in comparison charts, the instrument using CIE2000 DE will be inaccurately favored or appear falsely equivalent.
By the way, besides being dependent on the mathematics of the color-difference model, DE also depends on the choice of Standard Observer (which affects the XYZ functions) and on the choice of illuminant (which weights the instrument measurements with a standard spectrum). If you compare DE values, you should assure that the illuminant (usually D65) and observer (usually 1964) of the two DE values are the same. This statement applies to both CIELAB DE and CIE 2000 DE.
Following are the specifications for Datacolor instruments, including figures for repeatability and inter-instrument agreement – all using CIELAB DE with Illuminant D65 and 1964 Standard Observer:
To find the best spectrophotometer for your needs, be sure any specs you’re comparing use the same color difference formula. If you see a product comparison with DE values as the metric, beware and make sure the DE values are on the same scale. Otherwise, you may invest in instruments that don’t perform as expected in the field.
Our Datacolor team can help you better understand different color spaces. And we can show you a solution with the repeatability and inter-instrument agreement levels you’re looking for. Connect with us here.
(While this blog serves as an introduction, there is much more to consider. For those looking to go more in-depth on the topic, I invite you to read a recent article I wrote for Coloration Technology.)