A good Delta E tolerance is not one universal number. The right tolerance depends on the color, material, application, customer expectation, measurement method and business risk. In industrial color quality control, Delta E should be used as a practical decision tool: strict enough to protect product quality, but realistic enough to support production speed, supplier alignment and consistent approvals.
For most color-critical workflows, the best practice is to define tolerances by product category, color family, material type and end-use requirement. A tolerance standard should also specify the Delta E formula, measurement conditions, instrument setup, sample preparation method and how instrumental results are compared with visual assessment.
For teams building or improving a broader color workflow, it also helps to understand the fundamentals of digital color management and how objective measurement supports consistent color decisions.
What Is a Good Delta E Tolerance?
A good Delta E tolerance is the smallest practical color difference your business can control consistently while still meeting customer expectations.
Delta E measures the difference between a color standard and a measured sample. In quality control, it helps determine whether a batch, component, formulation or supplier submission is close enough to the approved standard.
For a deeper explanation of color difference calculations and color spaces, see Datacolor’s guide to CIELAB and CIE2000 color systems.
But Delta E should not be treated as a generic pass/fail number. A tolerance that works for a dark textile may be too loose for a pale plastic component. A tolerance suitable for an internal part may not be acceptable for a visible automotive interior, packaging surface, cosmetic product or brand-critical retail color.
The goal is not simply to set the lowest possible tolerance. The goal is to set a tolerance that is technically meaningful, visually relevant and operationally achievable.
Why One Delta E Tolerance Does Not Fit Every Color or Product
Delta E tolerance standards must reflect how color differences are actually perceived and how much variation the application can accept.
White, pastel and low-chroma colors can show perceptible differences differently than deep, saturated or high-chroma colors. Small shifts in lightness, hue or chroma may be more noticeable in one color region than another.
Surface characteristics such as gloss, texture, transparency, opacity and material structure can also affect how a color difference appears visually. Gloss, in particular, can have a measurable impact on perceived and instrumentally measured color. Learn more about how gloss impacts color measurements and matching.
That is why a single Delta E limit across all products often creates problems. It may be too strict for some materials, causing unnecessary rework or production delays. It may be too loose for other products, allowing visible mismatch, customer complaints or supplier disputes.
A better approach is to define tolerances by risk and use case. For example:
- Customer-facing colors may require tighter tolerances than hidden components.
- Brand colors may need stricter control than seasonal or low-risk colors.
- Multi-component products may need tighter alignment across materials.
- High-volume production may require tolerances that protect both quality and throughput.
- Supplier-submitted samples may need clear approval limits to reduce back-and-forth communication.
Which Delta E Formula Should You Use?
Choose one Delta E formula and make it part of your color standard. For many modern industrial workflows, CIEDE2000 or CMC are preferred because they better reflect visual perception than older color difference calculations in many applications.
The formula matters because different Delta E equations can produce different results for the same measured samples. If one supplier uses one formula and your internal lab uses another, both teams may believe they are meeting the standard while reporting different color differences.
If your team is standardizing formulas, tolerances and reporting across sites, it is also worth reviewing the role of inter-instrument agreement in consistent color decisions.
Your tolerance documentation should clearly state:
- Which Delta E formula is used
- The illuminant and observer settings
- The measurement geometry
- The instrument type
- Sample preparation requirements
- Whether tolerances apply to total Delta E only or also to lightness, chroma and hue differences
- How results are reviewed when instrumental and visual assessment do not fully agree
This level of detail improves repeatability within one site and reproducibility across labs, suppliers and production locations.
How to Align Delta E Tolerances with Visual Assessment
Delta E data should support visual assessment, not replace it without context.
Instrumental color measurement provides objective, repeatable data. Visual evaluation helps confirm whether the measured difference is meaningful in the real application. The strongest quality control programs use both: spectrophotometer data for consistency and auditability, and controlled visual assessment for practical acceptability.
Visual review should take place under controlled lighting conditions, using agreed viewing procedures and trained evaluators where possible. Without a consistent viewing environment, two people may disagree on the same sample because of lighting, background, observer sensitivity or viewing angle.
A controlled viewing environment is essential for reliable visual evaluation. Datacolor explains this further in its guides to light booths for color assessment and light sources in color evaluation.
If a sample passes Delta E but fails visually, the tolerance may not reflect the actual perception of that color or material. If a sample fails Delta E but appears visually acceptable, the tolerance may be unnecessarily strict for that use case. Both situations are signals to review the standard, not to ignore the data.
How Strict Should Your Delta E Tolerance Be?
Your Delta E tolerance should be strict enough to protect quality and customer confidence, but not so strict that it damages production efficiency.
Before tightening a tolerance, consider the operational impact. A very narrow tolerance may require more correction cycles, slower approvals, higher reject rates, additional lab time and more supplier escalations. In some workflows, this is justified. In others, it creates cost without meaningful quality improvement.
What Do Your Customers Expect?
Customer requirements should define the starting point. Some customers accept small visible variation. Others require tight color consistency because the product is brand-critical, safety-related, premium-positioned or visually compared against other components.
Does the Tolerance Match Visual Acceptability?
A tolerance standard should reflect what trained evaluators and customers actually consider acceptable. Instrument data that does not correlate with visual judgment can create confusion and unnecessary disputes.
What Is the Business Risk of a Mismatch?
Visible mismatch can lead to complaints, returns, rejected shipments, production delays or loss of customer confidence. Higher-risk products usually justify tighter tolerances and stronger documentation.
Can Your Process Consistently Meet the Tolerance?
A standard is only useful if the lab, production line and suppliers can apply it reliably. Instrument accuracy, repeatability, sample conditioning, operator technique and supplier capability all affect whether the tolerance can be maintained.
Measurement consistency also depends on environmental conditions, sample handling and instrument setup. For practical guidance, read best conditions for accurate color data and best practices for measuring color samples.
What Is the Cost-Benefit Balance?
Improved color matching can reduce waste, rework and approval cycles. But the tolerance must be connected to measurable business value. The best tolerance standard improves quality without creating avoidable bottlenecks.
Best Practices for Applying Delta E Tolerance Standards
The most effective Delta E tolerance standards are clear, specific and consistently applied across the color workflow.
1. Define Tolerances by Product and Color Family
Avoid one global tolerance for every color. Segment standards by product type, material, finish, color family and application risk.
2. Document the Measurement Method
Specify the instrument, geometry, aperture, illuminant, observer angle, calibration process and sample handling procedure. This reduces variation between operators, labs and suppliers.
For teams defining their measurement protocol, this guide to using a spectrophotometer for color measurement provides useful context on how instruments support objective color evaluation.
3. Combine Instrumental and Visual Evaluation
Use spectrophotometer data for objective control and visual assessment for real-world acceptability. Both should follow defined procedures.
4. Control Sample Preparation
Sample condition can affect measurement results. Define requirements for conditioning, thickness, backing, orientation, rotation, surface cleaning and measurement location where relevant.
Sample preparation can be a major source of variation. For more detail, see Datacolor’s guidance on sample measurement technique for digital color communication and sample conditioning for digital color measurement.
5. Align Suppliers Before Production
Supplier quality teams need the same standards, formulas and measurement procedures. Early alignment reduces approval delays, off-color submissions and disputes over measurement results.
For global or multi-site workflows, consistent color data also depends on clear digital color communication between brands, labs, suppliers and production teams.
6. Review Tolerances Using Production Data
Tolerance standards should not be static. Review rejection rates, rework patterns, customer complaints and approval cycle times. If tolerances are too loose or too strict, adjust them based on evidence.
7. Keep Records for Auditability
Digital color data creates a traceable record of standards, submissions, approvals and deviations. This supports quality audits, supplier performance reviews and faster root-cause analysis.
A structured quality program can make this easier to manage. Datacolor outlines the fundamentals in 5 steps for an effective color quality control program.
How Datacolor Supports Consistent Color Tolerances
Consistent Delta E tolerance management depends on reliable measurement, controlled workflows and clear digital communication.
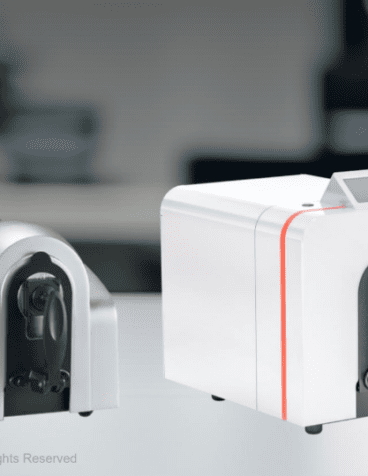
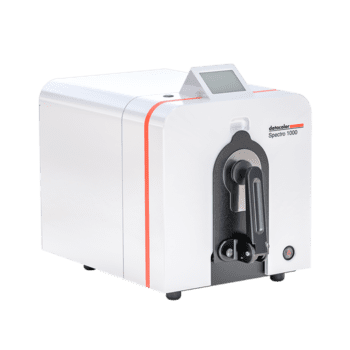
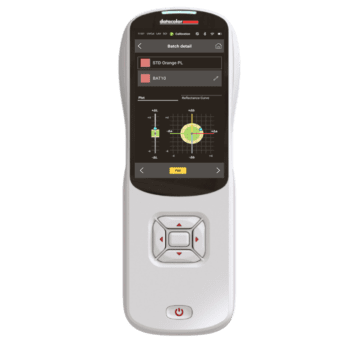
Datacolor spectrophotometers support objective color measurement across lab, production and supplier environments. Depending on the application, teams may use benchtop spectrophotometers for lab precision or portable spectrophotometers for production and field measurement.
Datacolor quality control software helps teams compare samples against standards, manage tolerances, document results and communicate color decisions more consistently. For software-supported color evaluation, explore Datacolor Tools and Colibri ColorQuality.
For organizations working across multiple suppliers, production sites or material types, a digital color workflow can reduce subjective back-and-forth, improve supplier alignment and support faster approvals. The result is not only better color control, but also less waste, fewer corrections and stronger confidence in production decisions.
FAQ: Delta E Tolerance Standards
What Does Delta E Tolerance Mean?
Delta E tolerance is the acceptable color difference between a standard and a measured sample. It defines how much variation is allowed before a sample is rejected or reviewed.
Is a Lower Delta E Always Better?
Not always. A lower Delta E means a smaller measured color difference, but very tight tolerances can increase cost, rework and approval delays if they are not necessary for the product or customer requirement.
Which Delta E Formula Is Best for Quality Control?
CIEDE2000 and CMC are commonly used in industrial color workflows because they often align better with visual perception than older formulas. The best choice depends on your material, industry and customer requirements.
Why Can Two Samples with the Same Delta E Look Different?
Delta E is a numerical summary of color difference, but perception can also be affected by hue direction, lightness, chroma, gloss, texture, transparency, lighting conditions and observer differences.
Should Delta E Replace Visual Assessment?
No. Delta E should support visual assessment. For critical color decisions, use controlled visual evaluation together with instrumental measurement.
How Do Suppliers Use Delta E Tolerances?
Suppliers use Delta E tolerances to check whether submitted samples, batches or components meet the approved color standard. Clear tolerances reduce disputes and speed up approvals.
How Often Should Delta E Tolerance Standards Be Reviewed?
Review tolerances when materials, suppliers, instruments, light sources, formulations or customer expectations change. Also review them when rejection rates, rework or customer complaints suggest that current limits are not working.
What Tools Help Manage Delta E Tolerances?
Spectrophotometers, controlled viewing environments and color quality control software help teams measure, evaluate, document and communicate color tolerances across the workflow.
Need to Improve Your Color Tolerance Workflow?
If your team is dealing with inconsistent approvals, supplier disputes, rework or unclear pass/fail decisions, Datacolor can help you evaluate your current color measurement process and define a more reliable tolerance workflow.
Connect with Our Color Experts!

 Want to Get Color Right?