Article by Ken Butts
This is the fourth post in our Keys to Digital Color Communication series. Previous posts in this series covered sample conditioning, reliable color communication and sample measurement technique.
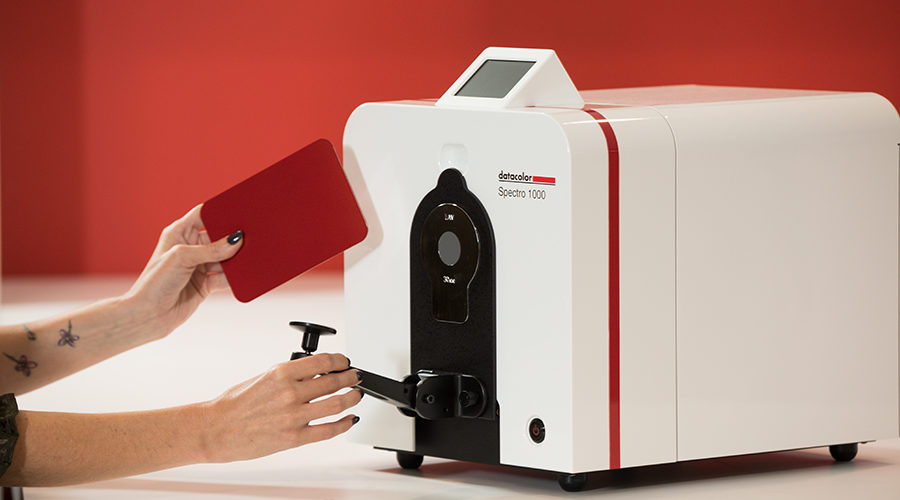
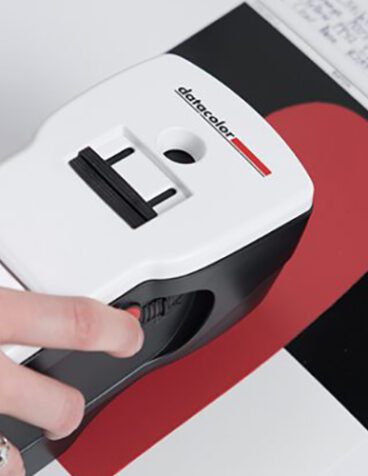
When it comes to digital color communication, one of the most important components is the color measuring instrument: the spectrophotometer.
The spectral data captured from a standard becomes the reference data for everyone involved in the design, development, approval and production process. If that data does not accurately represent the standard, every downstream color decision becomes less reliable.
That is why a spectrophotometer must be:
- Reliable
- Repeatable
- Properly maintained
- Aligned with other instruments in the supply chain
- Verified regularly
Accurate digital color communication depends not only on measuring the right sample, but also on ensuring the instrument itself produces trustworthy spectral data.
Related reading: keys to reliable digital color communication and sample measurement technique in digital color communication.
Why the Color Measuring Instrument Matters
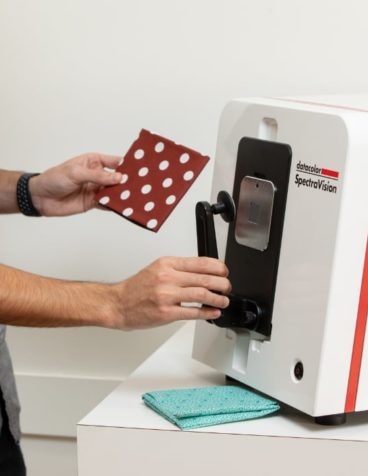
A spectrophotometer is a precision scientific instrument used to capture spectral data from a color standard or sample.
That data may be used by:
- Designers
- Product developers
- Colorists
- Laboratories
- Suppliers
- Quality control teams
- Production facilities
Because so many stakeholders rely on the same digital color data, the instrument must produce measurements that are accurate, repeatable and reproducible.
A reliable spectrophotometer should perform consistently:
- Compared with itself over time
- Compared with instruments of similar design
- Across different locations in the supply chain
Without this consistency, digital color communication can become a source of error rather than a solution.
Learn more in using a spectrophotometer for color measurement and the different types of color measurement instruments.
Why Repeatability Is Critical in Digital Color Communication
Repeatability means an instrument can measure the same sample multiple times and produce consistent results.
In digital color workflows, poor repeatability can affect:
- Stored standards
- Color approvals
- Formula predictions
- Supplier communication
- Pass/fail decisions
- Quality control confidence
If a standard is measured incorrectly at the beginning of the process, that error can move through the entire supply chain.
This is especially important in global color programs where one physical standard may be converted into digital data and shared with multiple suppliers.
For more on workflow reliability, see digital color communication and color measuring instruments and sample conditioning for digital color measurement.
Regular Evaluation and Maintenance Protect Measurement Accuracy
A spectrophotometer must be maintained as a precision instrument.
Regular evaluation and maintenance help ensure the instrument continues to perform within expected tolerances over time.
Maintenance supports:
- Long-term repeatability
- Measurement accuracy
- Instrument reliability
- Auditability
- Confidence in stored color data
Neglecting maintenance can lead to drift, inconsistent measurements and reduced trust in digital color communication.
Routine checks are especially important when instruments are used frequently, moved between locations or operated in challenging environments.
Related reading: best conditions for accurate color data and how to store, use and clean spectrophotometer calibration tiles.
What Is Instrument Correlation?
Instrument correlation is a process used to improve inter-instrument agreement.
It helps adjust spectral data to account for small changes caused by:
- Instrument drift
- Environmental conditions
- Normal instrument use
- Differences between instruments
Instrument correlation does not replace regular maintenance or service. Instead, it provides additional assurance that an instrument continues to perform closely to its original specifications.
This is particularly valuable when multiple instruments are used across a supply chain.
How Instrument Correlation Works
Instrument correlation typically involves comparing a test instrument against a master instrument.
The process includes:
- Measuring a set of target standards on the master instrument.
- Measuring the same standards on the test instrument.
- Comparing the measurement differences.
- Calculating correlation factors.
- Applying those factors to future measurements from the test instrument.
These correlation factors help bring the test instrument’s output closer to the master instrument.
Before correlation factors are calculated, diagnostics should be performed to confirm that the instrument is functioning properly.
If the instrument has a mechanical, optical or maintenance issue, correlation alone will not solve the problem.
Why Inter-Instrument Agreement Matters
Inter-instrument agreement refers to the ability of different instruments to produce compatible measurement results.
This matters because color supply chains often involve multiple sites and stakeholders.
A typical workflow may include:
- A brand office defining the standard
- A lab measuring and storing the standard
- A supplier developing a match
- A production facility checking batches
- A quality team approving finished goods
If each location uses a different instrument, those instruments must agree closely enough to support consistent decisions.
Poor inter-instrument agreement can lead to:
- Supplier disputes
- Repeated submissions
- Delayed approvals
- Wider tolerances
- Less reliable digital communication
- Higher risk of production inconsistency
Learn more in why inter-instrument agreement matters and how instrument profiling affects accurate color data.
Example: Spectrophotometer Correlation Results
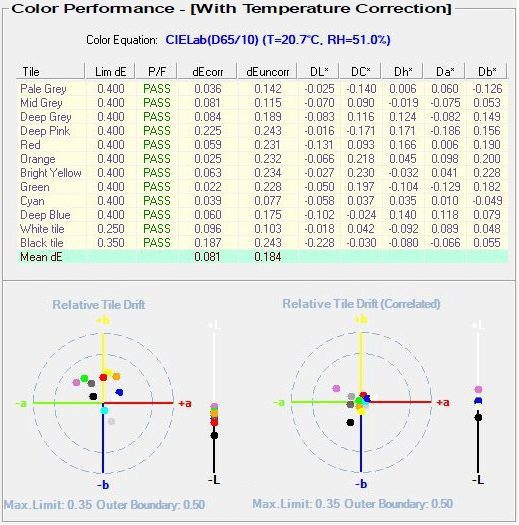
Figure 1. Spectrophotometer correlation results.
Figure 1 shows the results of a spectrophotometer correlation procedure.
The graph compares the variance of a spectrophotometer relative to a master instrument before and after correlation.
Before Correlation
- The maximum color difference for any ceramic BCRA tile was CIELab* DE 0.243.
- The average across twelve correlation samples was 0.184.
- This indicated slight drift beyond the original factory specification of 0.15 maximum and 0.10 average CIELab* DE.
After Correlation
- The maximum color difference was reduced to 0.225.
- The average was reduced to 0.081.
This shows that correlation can improve average agreement with the master instrument.
However, additional improvement may require instrument service.
It is also important to note that improved correlation on ceramic tiles does not guarantee equivalent improvement across all textile materials or production samples.
Instrument Correlation Is Only One Part of Reliable Color Data
Instrument correlation can improve the output of a spectrophotometer, but instrument drift is often only a small part of the total variation in digital color communication.
Other sources of measurement variation include:
- Sample conditioning
- Sample thickness
- Aperture size
- Measurement technique
- Operator handling
- Environmental conditions
- Sample texture or directionality
- Inconsistent procedures across suppliers
This is why digital color communication requires more than a calibrated instrument.
It requires a complete, standardized workflow.
Related reading: best practices for measuring color samples, how sample rotation improves color measurement accuracy and sample measurement technique in digital color communication.
Best Practices for Reliable Instrument Performance
To maintain confidence in digital color data, organizations should follow a structured instrument management process.
| Best Practice |
Why It Matters |
| Calibrate instruments regularly |
Helps maintain measurement accuracy |
| Keep calibration standards clean |
Prevents contaminated reference measurements |
| Monitor environmental conditions |
Reduces drift caused by temperature, humidity or contamination |
| Perform diagnostics before correlation |
Confirms the instrument is functioning correctly |
| Use instrument correlation where appropriate |
Improves agreement with the master instrument |
| Schedule routine maintenance |
Supports long-term repeatability and auditability |
| Standardize procedures across locations |
Improves reproducibility throughout the supply chain |
For broader guidance, see a guide to color spectrophotometer best practices.
Strong Digital Color Communication Starts with Trustworthy Instruments
Digital color communication depends on accurate spectral data.
That data depends on the performance of the color measuring instrument.
When spectrophotometers are reliable, maintained and aligned across the supply chain, organizations can make more confident color decisions.
This supports:
- Faster approvals
- Better supplier alignment
- Improved quality control
- Reduced rework
- Stronger auditability
- More consistent production
Instrument correlation can help improve agreement between instruments, but it should be part of a broader color management process that includes maintenance, diagnostics, controlled measurement conditions and standardized sample measurement techniques.
To improve your digital color workflow, explore Datacolor color management solutions or connect with an expert.
Improve the Reliability of Your Digital Color Data
Datacolor can help you evaluate spectrophotometer performance, instrument correlation and measurement consistency throughout your supply chain.
Connect with an Expert