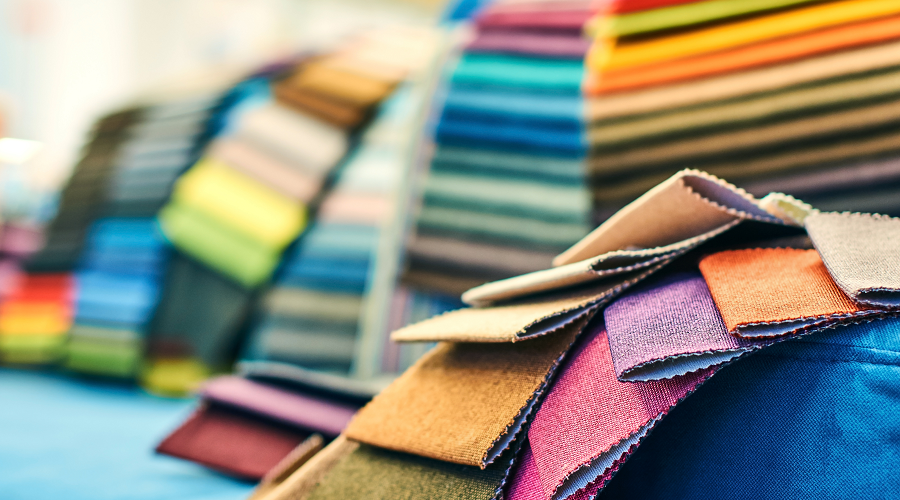
Sample conditioning is essential for repeatable digital color measurement. Temperature and humidity can affect textile samples, which means measurement data may change when samples are evaluated under different environmental conditions. This matters because digital color communication depends on reliable data. When color standards and production samples are measured in different locations, climates or lab environments, uncontrolled temperature and moisture variation can create false color differences. A sample may appear out of tolerance not because the color is wrong, but because it was not conditioned under the same conditions as the standard. For global textile supply chains, this is especially important. Brands, mills, dye houses, labs and suppliers may measure color in regions with very different environmental conditions. Without a defined conditioning process, digital color data becomes harder to trust. For broader workflow context, see digital color communication with color measurement instruments and keys to reliable digital color communication.
Why sample conditioning matters in color measurement
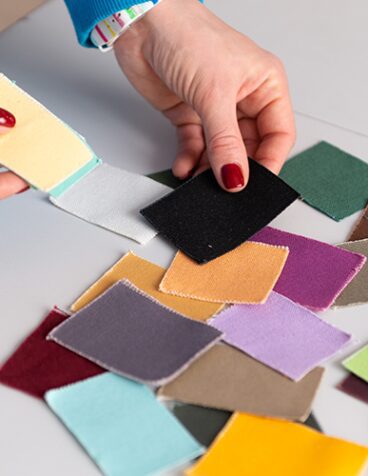
Sample conditioning helps reduce measurement variation caused by environmental changes. Textiles can respond to moisture and temperature. Different fibers, fabric constructions, dyes and colors may respond differently.
- Color standards
- Lab dips
- Production samples
- Supplier submissions
- Quality control checks
- Digital approvals
- Inter-lab comparisons
- Global color communication
Some samples may show only minor changes under changing conditions, while others may shift enough to affect calculated color difference. If environmental variation is not controlled, teams may see inconsistent results in: color standards; lab dips; production samples; supplier submissions; quality control checks; digital approvals; inter-lab comparisons; global color communication. The goal of conditioning is to make sure standards and samples are measured under comparable conditions. This improves repeatability and helps teams distinguish real color variation from environmental influence. For more on accurate measurement conditions, see best conditions for accurate color data and best practices for measuring color samples.
Why occasional environmental control is not enough
Textile manufacturers and retailers often evaluate many colors, fabric types and constructions. Because there are so many material and color combinations, it is not practical to adjust temperature and humidity only for specific fabrics or individual colors. Instead, environmental conditions should be defined, controlled and applied consistently across all samples. This is especially important when samples are measured globally. A textile sample measured in a humid production region may not produce the same data as the same sample measured in a dry office or lab environment. If both measurements are used for digital color communication, the results may lead to confusion, delays or unnecessary corrections. A better approach is to specify standard conditioning conditions and apply them consistently.
ASTM D1776 and textile sample conditioning
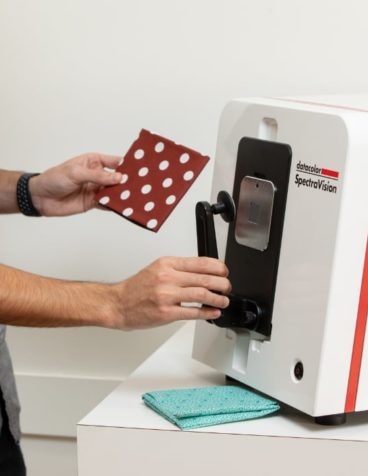
ASTM D1776, “Standard Practice for Conditioning and Testing Textiles,” provides guidance for textile conditioning and testing. The standard specifies laboratory conditions of: 21°C ± 1°C; 65% ± 2% relative humidity. These conditions are commonly used as a reference point for textile sample conditioning. They help create a stable environment for comparing color standards and samples. For color measurement workflows, the practical lesson is simple: condition both the standard and the batch sample under the same defined conditions before measurement. This is especially important when the color data will be shared digitally across suppliers, brands or labs. For related textile workflows, see color management solutions for textile and apparel and color management in textiles.
How temperature and humidity affect color data
Temperature and humidity can contribute to measurable color differences. In the original Datacolor study referenced for this topic, 100% cotton standards were used to evaluate how changes in temperature and relative humidity affected measured color differences. Color differences were calculated using DE CMC (2:1) under D65/10 conditions and compared against standards conditioned to ASTM-recommended values of 21°C and 65% relative humidity. The available table shows the effect of relative humidity variation while temperature remains constant at 21°C. The results show that smaller humidity variations may have limited impact for some samples, but larger changes can create more significant measured color differences. This reinforces a key point for digital color communication: color measurement data is only as reliable as the conditioning process behind it.
Relative humidity and color measurement
Relative humidity can affect measured color differences, especially when humidity changes are large. In the referenced cotton sample study, minor variations in relative humidity did not create major color differences when temperature was held constant. However, when humidity dropped further from the standard condition, the measured color differences increased for several colors. The largest variations appear in colors such as Bright Blue, Dark Orange, Dark Green, Light Violet, Dark Navy and Purple. These results show that some colors respond more strongly to environmental changes than others.
Table: Constant Temperature of 21°C with Variation in Relative Humidity
| Sample |
Value 1 |
Value 2 |
Value 3 |
Value 4 |
Value 5 |
Value 6 |
| 11 Dark Orange |
0.19 |
0.09 |
0.05 |
0.03 |
0.11 |
0.29 |
| 13 Light Orange |
0.10 |
0.04 |
0.02 |
0.03 |
0.06 |
0.12 |
| 14 Dark Brown |
0.11 |
0.05 |
0.06 |
0.05 |
0.06 |
0.16 |
| 18 Dark Yellow |
0.04 |
0.03 |
0.04 |
0.03 |
0.05 |
0.08 |
| 21 Dark Green |
0.15 |
0.09 |
0.04 |
0.07 |
0.14 |
0.29 |
| 24 Light Green |
0.11 |
0.05 |
0.04 |
0.05 |
0.05 |
0.16 |
| 25 Jade |
0.04 |
0.03 |
0.03 |
0.05 |
0.07 |
0.11 |
| 26 Medium Blue |
0.06 |
0.04 |
0.04 |
0.05 |
0.06 |
0.11 |
| 28 Bright Blue |
0.23 |
0.13 |
0.05 |
0.05 |
0.14 |
0.36 |
| 29 Dark Navy |
0.15 |
0.07 |
0.06 |
0.08 |
0.13 |
0.21 |
| 32 Maroon |
0.09 |
0.04 |
0.05 |
0.04 |
0.06 |
0.15 |
| 33 Purple |
0.13 |
0.07 |
0.03 |
0.05 |
0.08 |
0.20 |
| 34 Light Violet |
0.19 |
0.07 |
0.07 |
0.08 |
0.06 |
0.25 |
| 38 Black |
0.17 |
0.04 |
0.05 |
0.06 |
0.08 |
0.17 |
| 39 Tan |
0.05 |
0.03 |
0.04 |
0.05 |
0.07 |
0.10 |
The practical takeaway:
- Small humidity changes may not always create large differences.
- Larger humidity changes can affect measured color.
- Some colors are more sensitive than others.
- Standards and samples should be conditioned consistently.
- Humidity should be documented in color measurement procedures.
- Samples measured under different humidity conditions should not be compared without caution.
For operational guidance, see best conditions for accurate color data.
What the table shows
The table compares selected textile color samples under different relative humidity conditions while temperature remains constant at 21°C. Higher values indicate greater measured color variation. Several samples show relatively low variation across the measured conditions, while others show more noticeable differences. For example, Bright Blue shows one of the highest values in the table, while colors such as Dark Yellow, Jade and Tan remain comparatively lower. This does not mean every blue, green or orange textile will respond in exactly the same way. The key lesson is that fabric type, colorant and environmental condition can interact in different ways. That is why consistent conditioning is safer than assuming all samples will respond similarly.
Temperature and color measurement
Temperature can also affect textile color measurements. Some dyes, pigments and materials can change their color properties when temperature changes. This is related to thermochromism, where color appearance or measurement data shifts because the sample is warmer or cooler. If a sample has just come from production, storage, shipping or a non-controlled environment, it should not be measured immediately. The sample needs time to stabilize under the specified conditioning conditions. Practical takeaway: allow samples to acclimate before measurement; avoid measuring samples immediately after shipping or production; keep standards and samples in the same measurement environment; remeasure standards if temperature conditions have changed; include conditioning time in the standard operating procedure. For broader sample preparation guidance, see sample measurement technique for digital color communication.
Why combined environmental variation is risky
The greatest risk comes when both temperature and humidity vary. In real-world supply chains, samples may move between climates, storage environments and labs. A textile sample may be produced in one country, shipped across regions and measured somewhere else.
- Condition samples before measurement
- Use the same conditioning procedure for standards and batches
- Record environmental conditions
- Avoid comparing data from uncontrolled environments
- Remeasure standards when conditions change
- Train suppliers on conditioning requirements
If temperature and humidity both change, measurement data may shift enough to create confusion in color approval. This is why sample conditioning should not be treated as a minor lab detail. It is part of the quality control system. When temperature or humidity conditions vary, teams should: condition samples before measurement; use the same conditioning procedure for standards and batches; record environmental conditions; avoid comparing data from uncontrolled environments; remeasure standards when conditions change; train suppliers on conditioning requirements. For global color workflows, see fully digital color management workflow and what you need to know about vendor empowerment.
Why sample conditioning is critical for digital color communication
Digital color communication depends on consistency. When brands and suppliers exchange digital standards, QTX files or spectral data, they need confidence that the measured data reflects the color — not an uncontrolled measurement environment. If one lab measures a conditioned sample and another measures an unconditioned sample, the results may not align.
- False rejects
- Unnecessary lab dip rounds
- Supplier disputes
- Repeated corrections
- Delayed approvals
- Loss of trust in digital data
- Inconsistent production decisions
This can cause: false rejects; unnecessary lab dip rounds; supplier disputes; repeated corrections; delayed approvals; loss of trust in digital data; inconsistent production decisions. Sample conditioning helps reduce these risks. It makes digital color data more repeatable and easier to compare across locations. For more on accurate digital standards, see keeping customer color standards and digital color communication with color measurement instruments.
Best practices for conditioning textile samples
A reliable conditioning process should be documented and repeated consistently.
1. Define standard conditioning conditions Use a defined temperature and humidity standard, such as 21°C ± 1°C and 65% ± 2% RH where applicable to the workflow
2. Condition standards and samples together Standards and production samples should be conditioned under the same conditions before comparison
3. Allow enough conditioning time Samples need time to reach equilibrium with the environment
Do not measure immediately after shipping, storage or production changes.
4. Control humidity and temperature continuously Occasional control is not enough
The measurement environment or conditioning cabinet should maintain stable conditions.
5. Use a conditioning cabinet when needed If controlling a full lab area is not practical, a conditioning cabinet can help stabilize samples before measurement
6. Document conditions in the SOP Temperature, humidity, conditioning time and sample handling should be included in the measurement procedure
7. Train suppliers and labs All partners involved in digital color communication should understand and follow the same conditioning requirements
For implementation support, see 5 steps for an effective color quality control program and effective color program.
When should you remeasure standards?
Remeasure standards when environmental conditions have changed or when there is reason to believe the standard may no longer represent the same measurement state. Remeasurement is especially important when: standards were stored in a different environment; the lab temperature or humidity changed; samples were shipped from another climate; the conditioning process was not followed; measurement data looks inconsistent; suppliers report unexpected color differences; production samples are being evaluated after environmental exposure. Remeasuring standards under controlled conditions helps ensure that the comparison between standard and sample is fair.
- Standards were stored in a different environment
- The lab temperature or humidity changed
- Samples were shipped from another climate
- The conditioning process was not followed
- Measurement data looks inconsistent
- Suppliers report unexpected color differences
- Production samples are being evaluated after environmental exposure
For more on standards and instrument reliability, see how to store, use and clean spectrophotometer calibration tiles and why inter-instrument agreement matters.
Sample conditioning checklist
Use this checklist before measuring textile samples:
- Are the standard and sample conditioned under the same conditions?
- Is the conditioning environment set to the required temperature?
- Is relative humidity controlled and stable?
- Has the sample had enough time to acclimate?
- Was the sample recently shipped, stored or exposed to production heat?
- Are conditions documented in the SOP?
- Are suppliers using the same conditioning requirements?
- Has the standard been remeasured after environmental changes?
- Is the measurement environment stable?
- Are results being compared only after proper conditioning?
Consistent conditioning leads to more trustworthy color data.
How Datacolor supports repeatable color measurement
Datacolor supports repeatable digital color measurement with spectrophotometers, software and workflow expertise for textile and apparel supply chains. Relevant Datacolor solutions include: spectrophotometers for objective color measurement; Datacolor Tools for quality control and reporting; Datacolor Match Textile for formulation and correction; light booths for controlled visual evaluation; services to support workflow implementation and supplier alignment. Explore color management solutions for textile and apparel, Datacolor Tools, Datacolor Match Textile, Spectro 1000 and Spectro 700.
- Spectrophotometers for objective color measurement
- Datacolor Tools for quality control and reporting
- Datacolor Match Textile for formulation and correction
- Light booths for controlled visual evaluation
- Services to support workflow implementation and supplier alignment
With proper sample conditioning, consistent measurement procedures and reliable instruments, textile teams can improve digital color communication and reduce unnecessary variation across the supply chain.
FAQ: sample conditioning for digital color measurement
What is sample conditioning?
Sample conditioning is the process of allowing a textile sample to stabilize under defined temperature and humidity conditions before measurement or testing.
Why is sample conditioning important for color measurement?
Sample conditioning helps reduce color measurement variation caused by changes in temperature and moisture content. This improves repeatability and makes digital color data more reliable.
What are the standard conditioning conditions for textiles?
ASTM D1776 specifies 21°C ± 1°C and 65% ± 2% relative humidity for conditioning and testing textiles.
Can humidity affect measured color?
Yes. Large changes in relative humidity can affect measured color differences, especially when comparing samples conditioned under very different humidity levels.
Can temperature affect measured color?
Yes. Temperature changes can affect some dyes, pigments and materials. Samples should be allowed to stabilize before measurement.
Why is conditioning important for global supply chains?
Samples may be measured in different climates and labs around the world. Conditioning helps ensure that color data is comparable across locations.
Should standards and production samples be conditioned together?
Yes. Standards and production samples should be conditioned under the same defined conditions before they are measured and compared.
What happens if samples are not conditioned?
Unconditioned samples may produce inconsistent measurements, false color differences, unnecessary rejects or delays in approval.
Is a conditioning cabinet useful?
Yes. A conditioning cabinet can provide stable sample conditioning conditions when it is too expensive or impractical to control an entire room.
How does sample conditioning support digital color communication?
It improves the reliability of the color data being shared across brands, suppliers and labs, helping teams make more consistent approval decisions.
Ready to improve measurement repeatability?
If color data varies across suppliers, labs or production locations, sample conditioning may be part of the issue. Datacolor can help you build a more repeatable digital color measurement workflow.
Ready to improve measurement repeatability?
If color data varies across suppliers, labs or production locations, sample conditioning may be part of the issue. Datacolor can help you build a more repeatable digital color measurement workflow.
Chat with a Color Expert